


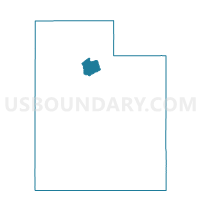
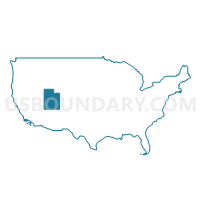
Census Tract 1101.03, Salt Lake County, Utah
About
Outline

Summary
| Unique Area Identifier | 498494 |
| Name | Census Tract 1101.03 |
| County | Salt Lake County |
| State | Utah |
| Area (square miles) | 98.72 |
| Land Area (square miles) | 98.57 |
| Water Area (square miles) | 0.15 |
| % of Land Area | 99.85 |
| % of Water Area | 0.15 |
| Latitude of the Internal Point | 40.74115100 |
| Longtitude of the Internal Point | -111.75873030 |
| Total Population | 3,620 |
| Total Housing Units | 1,653 |
| Total Households | 1,367 |
| Median Age | 45.5 |
Maps

Graphs
Select a template below for downloading or customizing gragh for Census Tract 1101.03, Salt Lake County, Utah


Neighbors
Neighoring Census Tract (by Name) Neighboring Census Tract on the Map
- Census Tract 1002, Salt Lake County, UT
- Census Tract 1014, Salt Lake County, UT
- Census Tract 1042, Salt Lake County, UT
- Census Tract 1044, Salt Lake County, UT
- Census Tract 1101.04, Salt Lake County, UT
- Census Tract 1102, Salt Lake County, UT
- Census Tract 1105, Salt Lake County, UT
- Census Tract 1148, Salt Lake County, UT
- Census Tract 1264.02, Davis County, UT
- Census Tract 9643.03, Summit County, UT
- Census Tract 9643.04, Summit County, UT
- Census Tract 9643.05, Summit County, UT
- Census Tract 9702, Morgan County, UT
Top 10 Neighboring County Subdivision (by Population) Neighboring County Subdivision on the Map
- Salt Lake City CCD, Salt Lake County, UT (932,320)
- South Davis CCD, Davis County, UT (109,054)
- Park City CCD, Summit County, UT (24,696)
- Emigration CCD, Salt Lake County, UT (8,908)
- Morgan South CCD, Morgan County, UT (1,427)
Top 10 Neighboring Place (by Population) Neighboring Place on the Map
- Salt Lake City city, UT (186,440)
- Millcreek CDP, UT (62,139)
- Summit Park CDP, UT (7,775)
- Emigration Canyon CDP, UT (1,567)
Top 10 Neighboring Unified School District (by Population) Neighboring Unified School District on the Map
- Granite School District, UT (385,194)
- Davis School District, UT (306,479)
- Canyons School District, UT (204,224)
- Salt Lake City School District, UT (186,440)
- Park City School District, UT (24,401)
- Morgan School District, UT (9,469)
Top 10 Neighboring State Legislative District Lower Chamber (by Population) Neighboring State Legislative District Lower Chamber on the Map
- State House District 20, UT (38,155)
- State House District 53, UT (37,757)
- State House District 25, UT (34,235)
- State House District 24, UT (32,363)
- State House District 36, UT (29,535)
- State House District 28, UT (29,137)
Top 10 Neighboring State Legislative District Upper Chamber (by Population) Neighboring State Legislative District Upper Chamber on the Map
- State Senate District 26, UT (101,392)
- State Senate District 19, UT (91,855)
- State Senate District 23, UT (87,939)
- State Senate District 2, UT (82,957)
- State Senate District 7, UT (79,585)
- State Senate District 4, UT (76,928)
Top 10 Neighboring 111th Congressional District (by Population) Neighboring 111th Congressional District on the Map
Top 10 Neighboring 5-Digit ZIP Code Tabulation Area (by Population) Neighboring 5-Digit ZIP Code Tabulation Area on the Map
- 84116, UT (33,297)
- 84109, UT (23,858)
- 84124, UT (21,295)
- 84103, UT (21,084)
- 84108, UT (20,738)
- 84098, UT (17,282)
- 84050, UT (9,290)
Data
Demographic, Population, Households, and Housing Units
** Data sources from census 2010 **
Show Data on Map
Download Full List as CSV
Download Quick Sheet as CSV
| Subject | This Area | Salt Lake County | Utah | National |
|---|---|---|---|---|
| POPULATION | ||||
| Total Population Map | 3,620 | 1,029,655 | 2,763,885 | 308,745,538 |
| POPULATION, HISPANIC OR LATINO ORIGIN | ||||
| Not Hispanic or Latino Map | 3,494 | 853,640 | 2,405,545 | 258,267,944 |
| Hispanic or Latino Map | 126 | 176,015 | 358,340 | 50,477,594 |
| POPULATION, RACE | ||||
| White alone Map | 3,376 | 836,074 | 2,379,560 | 223,553,265 |
| Black or African American alone Map | 17 | 16,404 | 29,287 | 38,929,319 |
| American Indian and Alaska Native alone Map | 13 | 9,157 | 32,927 | 2,932,248 |
| Asian alone Map | 117 | 33,987 | 55,285 | 14,674,252 |
| Native Hawaiian and Other Pacific Islander alone Map | 7 | 15,781 | 24,554 | 540,013 |
| Some Other Race alone Map | 25 | 85,958 | 166,754 | 19,107,368 |
| Two or More Races Map | 65 | 32,294 | 75,518 | 9,009,073 |
| POPULATION, SEX | ||||
| Male Map | 1,827 | 517,881 | 1,388,317 | 151,781,326 |
| Female Map | 1,793 | 511,774 | 1,375,568 | 156,964,212 |
| POPULATION, AGE (18 YEARS) | ||||
| 18 years and over Map | 2,793 | 729,874 | 1,892,858 | 234,564,071 |
| Under 18 years | 827 | 299,781 | 871,027 | 74,181,467 |
| POPULATION, AGE | ||||
| Under 5 years | 192 | 90,106 | 263,924 | 20,201,362 |
| 5 to 9 years | 232 | 85,529 | 249,572 | 20,348,657 |
| 10 to 14 years | 242 | 78,783 | 227,951 | 20,677,194 |
| 15 to 17 years | 161 | 45,363 | 129,580 | 12,954,254 |
| 18 and 19 years | 68 | 29,410 | 91,510 | 9,086,089 |
| 20 years | 31 | 14,742 | 42,204 | 4,519,129 |
| 21 years | 18 | 15,341 | 45,173 | 4,354,294 |
| 22 to 24 years | 91 | 49,821 | 139,142 | 12,712,576 |
| 25 to 29 years | 127 | 90,884 | 229,554 | 21,101,849 |
| 30 to 34 years | 146 | 86,337 | 216,133 | 19,962,099 |
| 35 to 39 years | 204 | 72,039 | 178,401 | 20,179,642 |
| 40 to 44 years | 266 | 62,959 | 154,074 | 20,890,964 |
| 45 to 49 years | 315 | 62,450 | 154,831 | 22,708,591 |
| 50 to 54 years | 364 | 60,992 | 152,133 | 22,298,125 |
| 55 to 59 years | 348 | 53,920 | 133,122 | 19,664,805 |
| 60 and 61 years | 120 | 18,129 | 46,154 | 7,113,727 |
| 62 to 64 years | 157 | 23,483 | 60,965 | 9,704,197 |
| 65 and 66 years | 69 | 12,741 | 34,485 | 5,319,902 |
| 67 to 69 years | 101 | 16,274 | 44,995 | 7,115,361 |
| 70 to 74 years | 127 | 20,480 | 58,744 | 9,278,166 |
| 75 to 79 years | 109 | 15,626 | 45,835 | 7,317,795 |
| 80 to 84 years | 70 | 12,525 | 34,412 | 5,743,327 |
| 85 years and over | 62 | 11,721 | 30,991 | 5,493,433 |
| MEDIAN AGE BY SEX | ||||
| Both sexes Map | 45.50 | 30.80 | 29.20 | 37.20 |
| Male Map | 45.20 | 30.30 | 28.70 | 35.80 |
| Female Map | 45.90 | 31.30 | 29.70 | 38.50 |
| HOUSEHOLDS | ||||
| Total Households Map | 1,367 | 342,622 | 877,692 | 116,716,292 |
| HOUSEHOLDS, HOUSEHOLD TYPE | ||||
| Family households: Map | 1,042 | 242,626 | 660,234 | 77,538,296 |
| Husband-wife family Map | 931 | 187,678 | 535,827 | 56,510,377 |
| Other family: Map | 111 | 54,948 | 124,407 | 21,027,919 |
| Male householder, no wife present Map | 38 | 17,536 | 38,858 | 5,777,570 |
| Female householder, no husband present Map | 73 | 37,412 | 85,549 | 15,250,349 |
| Nonfamily households: Map | 325 | 99,996 | 217,458 | 39,177,996 |
| Householder living alone Map | 230 | 75,064 | 164,018 | 31,204,909 |
| Householder not living alone Map | 95 | 24,932 | 53,440 | 7,973,087 |
| HOUSEHOLDS, HISPANIC OR LATINO ORIGIN OF HOUSEHOLDER | ||||
| Not Hispanic or Latino householder: Map | 1,332 | 300,979 | 793,895 | 103,254,926 |
| Hispanic or Latino householder: Map | 35 | 41,643 | 83,797 | 13,461,366 |
| HOUSEHOLDS, RACE OF HOUSEHOLDER | ||||
| Householder who is White alone | 1,304 | 295,176 | 785,761 | 89,754,352 |
| Householder who is Black or African American alone | 5 | 4,820 | 8,252 | 14,129,983 |
| Householder who is American Indian and Alaska Native alone | 3 | 2,560 | 9,152 | 939,707 |
| Householder who is Asian alone | 36 | 10,653 | 16,474 | 4,632,164 |
| Householder who is Native Hawaiian and Other Pacific Islander alone | 1 | 3,213 | 5,253 | 143,932 |
| Householder who is Some Other Race alone | 7 | 20,089 | 39,501 | 4,916,427 |
| Householder who is Two or More Races | 11 | 6,111 | 13,299 | 2,199,727 |
| HOUSEHOLDS, HOUSEHOLD TYPE BY HOUSEHOLD SIZE | ||||
| Family households: Map | 1,042 | 242,626 | 660,234 | 77,538,296 |
| 2-person household Map | 497 | 80,900 | 222,850 | 31,882,616 |
| 3-person household Map | 215 | 51,129 | 130,366 | 17,765,829 |
| 4-person household Map | 186 | 48,540 | 126,309 | 15,214,075 |
| 5-person household Map | 91 | 30,567 | 88,513 | 7,411,997 |
| 6-person household Map | 41 | 17,242 | 52,732 | 3,026,278 |
| 7-or-more-person household Map | 12 | 14,248 | 39,464 | 2,237,501 |
| Nonfamily households: Map | 325 | 99,996 | 217,458 | 39,177,996 |
| 1-person household Map | 230 | 75,064 | 164,018 | 31,204,909 |
| 2-person household Map | 81 | 18,211 | 34,119 | 6,360,012 |
| 3-person household Map | 9 | 4,072 | 9,684 | 992,156 |
| 4-person household Map | 4 | 1,773 | 6,145 | 411,171 |
| 5-person household Map | 1 | 558 | 1,688 | 126,634 |
| 6-person household Map | 0 | 184 | 1,457 | 48,421 |
| 7-or-more-person household Map | 0 | 134 | 347 | 34,693 |
| HOUSING UNITS | ||||
| Total Housing Units Map | 1,653 | 364,031 | 979,709 | 131,704,730 |
| HOUSING UNITS, OCCUPANCY STATUS | ||||
| Occupied Map | 1,367 | 342,622 | 877,692 | 116,716,292 |
| Vacant Map | 286 | 21,409 | 102,017 | 14,988,438 |
| HOUSING UNITS, OCCUPIED, TENURE | ||||
| Owned with a mortgage or a loan Map | 823 | 181,521 | 471,931 | 52,979,430 |
| Owned free and clear Map | 409 | 48,898 | 146,206 | 23,006,644 |
| Renter occupied Map | 135 | 112,203 | 259,555 | 40,730,218 |
| HOUSING UNITS, VACANT, VACANCY STATUS | ||||
| For rent Map | 8 | 8,267 | 20,176 | 4,137,567 |
| Rented, not occupied Map | 2 | 562 | 1,408 | 206,825 |
| For sale only Map | 31 | 4,709 | 14,580 | 1,896,796 |
| Sold, not occupied Map | 13 | 820 | 2,828 | 421,032 |
| For seasonal, recreational, or occasional use Map | 215 | 3,241 | 47,978 | 4,649,298 |
| For migrant workers Map | 0 | 5 | 232 | 24,161 |
| Other vacant Map | 17 | 3,805 | 14,815 | 3,652,759 |
| HOUSING UNITS, OCCUPIED, AVERAGE HOUSEHOLD SIZE BY TENURE | ||||
| Total: Map | 2.65 | 2.96 | 3.10 | 2.58 |
| Owner occupied Map | 2.66 | 3.13 | 3.21 | 2.65 |
| Renter occupied Map | 2.58 | 2.63 | 2.82 | 2.44 |
| HOUSING UNITS, OCCUPIED, TENURE BY RACE OF HOUSEHOLDER | ||||
| Owner occupied: Map | 1,232 | 230,419 | 618,137 | 75,986,074 |
| Householder who is White alone Map | 1,173 | 207,849 | 572,530 | 63,446,275 |
| Householder who is Black or African American alone Map | 5 | 1,444 | 2,896 | 6,261,464 |
| Householder who is American Indian and Alaska Native alone Map | 3 | 914 | 4,825 | 509,588 |
| Householder who is Asian alone Map | 36 | 6,441 | 10,203 | 2,688,861 |
| Householder who is Native Hawaiian and Other Pacific Islander alone Map | 0 | 1,519 | 2,469 | 61,911 |
| Householder who is Some Other Race alone Map | 6 | 9,322 | 18,506 | 1,975,817 |
| Householder who is Two or More Races Map | 9 | 2,930 | 6,708 | 1,042,158 |
| Renter occupied: Map | 135 | 112,203 | 259,555 | 40,730,218 |
| Householder who is White alone Map | 131 | 87,327 | 213,231 | 26,308,077 |
| Householder who is Black or African American alone Map | 0 | 3,376 | 5,356 | 7,868,519 |
| Householder who is American Indian and Alaska Native alone Map | 0 | 1,646 | 4,327 | 430,119 |
| Householder who is Asian alone Map | 0 | 4,212 | 6,271 | 1,943,303 |
| Householder who is Native Hawaiian and Other Pacific Islander alone Map | 1 | 1,694 | 2,784 | 82,021 |
| Householder who is Some Other Race alone Map | 1 | 10,767 | 20,995 | 2,940,610 |
| Householder who is Two or More Races Map | 2 | 3,181 | 6,591 | 1,157,569 |
| HOUSING UNITS, OCCUPIED, TENURE BY HISPANIC OR LATINO ORIGIN OF HOUSEHOLDER | ||||
| Owner occupied: Map | 1,232 | 230,419 | 618,137 | 75,986,074 |
| Not Hispanic or Latino householder Map | 1,208 | 209,781 | 575,835 | 69,617,625 |
| Hispanic or Latino householder Map | 24 | 20,638 | 42,302 | 6,368,449 |
| Renter occupied: Map | 135 | 112,203 | 259,555 | 40,730,218 |
| Not Hispanic or Latino householder Map | 124 | 91,198 | 218,060 | 33,637,301 |
| Hispanic or Latino householder Map | 11 | 21,005 | 41,495 | 7,092,917 |
| HOUSING UNITS, OCCUPIED, TENURE BY HOUSEHOLD SIZE | ||||
| Owner occupied: Map | 1,232 | 230,419 | 618,137 | 75,986,074 |
| 1-person household Map | 202 | 38,849 | 94,206 | 16,453,569 |
| 2-person household Map | 522 | 69,376 | 188,793 | 27,618,605 |
| 3-person household Map | 205 | 38,107 | 96,780 | 12,517,563 |
| 4-person household Map | 171 | 36,882 | 96,305 | 10,998,793 |
| 5-person household Map | 84 | 23,339 | 69,008 | 5,057,765 |
| 6-person household Map | 39 | 13,371 | 42,286 | 1,965,796 |
| 7-or-more-person household Map | 9 | 10,495 | 30,759 | 1,373,983 |
| Renter occupied: Map | 135 | 112,203 | 259,555 | 40,730,218 |
| 1-person household Map | 28 | 36,215 | 69,812 | 14,751,340 |
| 2-person household Map | 56 | 29,735 | 68,176 | 10,624,023 |
| 3-person household Map | 19 | 17,094 | 43,270 | 6,240,422 |
| 4-person household Map | 19 | 13,431 | 36,149 | 4,626,453 |
| 5-person household Map | 8 | 7,786 | 21,193 | 2,480,866 |
| 6-person household Map | 2 | 4,055 | 11,903 | 1,108,903 |
| 7-or-more-person household Map | 3 | 3,887 | 9,052 | 898,211 |
Loading...